
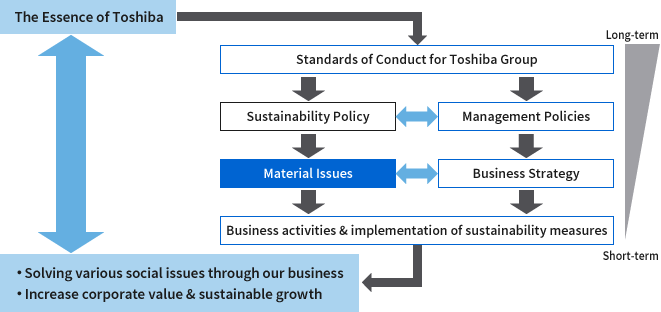
Guided by the Essence of Toshiba, Toshiba Group works on material issues that could impact business activities from a medium and long-term perspective in accordance with the Sustainability Policy and promotes sustainability management that contributes to the development of society.
We have tackled the material issues identified in 2013 by regularly confirming their status. However, response to climate change is now required on a global scale, and social issues are changing according to various perspectives as seen in the SDGs adopted by the United Nations. Toshiba Group also reviewed its businesses. Accordingly, we re-identified new material issues in FY2021.
We position the material issues under the Essence of Toshiba and the Sustainability Policy, and will work on initiatives Group-wide.
Toshiba Group’s Material Issues
We believe that in order for people and businesses to survive, it is vital that the earth, in which we live, is safe, stable, and a place that humans can thrive. Guided by the Essence of Toshiba, our business activities contribute to finding solutions to a range of social issues and supporting the sustainable growth of society, in consideration of not only the present global environment but also the planet in the future. We recognize the importance of maintaining a management foundations with integrity and transparency to support our business activities, and, to that end, have set out the following as material issues to be addressed by Toshiba Group so as to increase our corporate value. In FY2025, to further accelerate our growth initiatives, we have re-identified our material issues to better contribute to the enhancement of corporate value and are strengthening our Group-wide initiatives.
By addressing these material issues, we will push forward with the strengthening of ESG in order to achieve our vision for 2030. In the area of E (environment), we are working to achieve carbon neutrality and a circular economy while promoting activities that give consideration to ecosystems, such as responding to water risks and conserving biodiversity. In the area of S (social), we are working to realize a culture of respect for human rights as a prerequisite for nurturing people and technologies that create abundant value and give back to society. In the area of G (governance), we are working to realize management with integrity by strengthening our governance risk compliance, enhancing cyber resilience, and ensuring the safe and secure use of AI.
| Vision for 2030 | Material Issues | |
|---|---|---|
| For the irreplaceable global environment in which we live | Promote corporate activities with full consideration for the global environment throughout our value chain, from design, procurement, manufacturing, logistics and sales, through to disposal. |
|
| For respect of human rights, to nurture people and technology, and to give back to society | Encourage every Group employee to feel pride and fulfillment in their work, and to harness creativity and technology in collaborating with business partners to realize rich value. |
|
| For further strengthening thorough governance | Practice transparent corporate governance and optimal internal controls; and execute management with integrity, trusted by stakeholders. |
|
KPIs
The Sustainability Strategy Committee decides on KPIs in line with material issues and we work on them.The Sustainability Promotion Committee monitors efforts related to these items to strengthen future initiatives.
For the irreplaceable global environment in which we live
Respond to Climate Change
| KPIs | FY2023 | FY2024 | FY2025 | |
|---|---|---|---|---|
| Achievements | Targets | Achievements | Targets | |
Reduction rate of total GHG emissions (Scope 1+Scope 2)*1*2 <compared to FY2019> |
ー | 32% reduction | 59% reduction | 44% reduction |
Reduction rate of total GHG emissions (Scope 3) *2 <compared to FY2019> |
ー | 59% reduction | 71% reduction | 61% reduction |
| Avoided GHG emissions through the use of products and services associated with energy consumption*2*3 <cumulative total from FY2019> |
ー | 108 million t-CO2 | 106.99 million t-CO2 | 114 million t-CO2 |
- CO2 emissions from electricity and city gas are calculated using the values published under the Ministry of the Environment’s GHG emissions calculation, reporting, and disclosure system, or the emission coefficients provided by power companies.
Scope 2 emissions are calculated using the market-based approach in accordance with the GHG Protocol "Scope 2 Guidance." - Tracking for this item began in FY2024, following a review of the metrics items in our Environmental Action Plan.
- Avoided GHG emissions by products and services associated with power consumption, such as social infrastructure products. The calculation method is as follows:
Obtain the difference between total GHG emissions of assumed substitute products and total GHG emissions during use of shipped products for a single year and multiply it by the expected product life.
See below for details of achievements and initiatives.
Respond to the Circular Economy
| KPIs | FY2023 | FY2024 | FY2025 | |
|---|---|---|---|---|
| Achievement | Target | Achievement | Target | |
| Rate of improvement in the total volume of waste generated per unit at business and production sites*1 <compared to the FY2022 basic unit> | 4% improvement | 2% improvement | 12% improvement | 3% improvement |
- For the basic-unit targets, we use the nominal output, the number of products manufactured, the number of people, the total floor area, etc. for assessing activities.
See below for details of achievements and initiatives.
Consider Ecosystems
| KPIs | FY2023 | FY2024 | FY2025 | |
|---|---|---|---|---|
| Achievements | Targets | Achievements | Targets | |
| Rate of improvement in the amount of water received per unit at business and production sites*1 <compared to the FY2022 basic unit> | 16% deterioration | 2% improvement | 1.6% improvement |
3% improvement |
| Expanded contributions to the “7 GBF Targets”*2 of focus in biodiversity conservation activities*3 | ー | Formulated for each site | Implementation is proceeding as planned at the target sites | Formulated for each site |
- For the basic-unit targets, we use the nominal output, the number of products manufactured, the number of people, the total floor area, etc. for assessing activities.
- GBF (Global Biodiversity Framework) refers to the "Kunming-Montreal Global Biodiversity Framework" formulated at the 15th Conference of the Parties to the Convention on Biological Diversity (COP15) held in December 2022. This is a set of global goals for biodiversity conservation consisting of elements such as the 2050 Vision, 2030 Mission, 2050 Goals, and 2030 Targets (23 activity targets). The seven targets refer to the following targets in the 2030 targets for achieving nature-positive: "Target 3: 30 by 30," "Target 4: Species and gene conservation," "Target 6: Invasive species control," "Target 7: Pollution prevention/reduction," "Target 8: Climate change measures," "Target 11: Utilization of nature’s regulatory functions," and "Target 12: Securing green and water-friendly spaces"; Toshiba Group aims to contribute to achieving these targets at our sites in and outside Japan.
- Tracking for this item began in FY2024, following a review of the items in our Environmental Action Plan.
See below for details of achievements and initiatives.
For respect of human rights, to nurture people and technology, and to give back to society
Secure, Retain and Train Human Resources
| KPIs | FY2023 | FY2024 | FY2025 | |
|---|---|---|---|---|
| Achievements | Targets | Achievements | Targets | |
| Percentage of female employees in executive and in managerial positions (Percentage of female exempt employees)*1 | 6.2% | 7.2% | 6.6% | 8.0% |
| Set a target of 8% for FY2025 | ||||
| Engagement score in the employee engagement survey*2 | 57 points | 58 points | 59 points | 59 points |
- For full-time employees at Toshiba, Toshiba Energy Systems & Solutions Corporation, Toshiba Infrastructure Systems & Solutions Corporation, Toshiba Electronic Devices & Storage Corporation, and Toshiba Digital Solutions Corporation
- All Group companies participating in the survey are included. (Reference: In FY2022, 87 Toshiba Group companies in Japan and overseas participated; in FY2023, 95 companies participated; and in FY2024, 97 companies participated.)
See below for details of achievements and initiatives.
- Toshiba Infrastructure Systems & Solutions Corporation has been integrated into Toshiba Corporation on April 1, 2025.
- Toshiba Energy Systems & Solutions Corporation and Toshiba Digital Solutions Corporation were integrated into Toshiba Corporation as of April 1, 2026.
Ensure Employee Health and Safety
| KPIs | FY2023 | FY2024 | FY2025 | |
|---|---|---|---|---|
| Achievements | Targets | Achievements | Targets | |
| Fatalities due to work-related accidents | 3 (1 overseas) | Zero (no accidents) | Zero (no accidents) | Zero (no accidents) |
| Severity rate of work-related accidents*1 | 0.103 | 0.010*2 or less |
0.003 | 0.010*2 or less |
| Ratio of employees with metabolic syndrome*1 | 34.6% | Same as the previous fiscal year or less | 35.2% | Same as the previous fiscal year or less |
- At Toshiba and Toshiba Group in Japan
- The target value is the average value (value published by Ministry of Health, Labour and Welfare) for the electrical appliance industry (companies of 1,000 employees or more) for 2020
See below for details of achievements and initiatives.
Respect for Human Rights
| KPIs | FY2023 | FY2024 | FY2025 | |
|---|---|---|---|---|
| Achievements | Targets | Achievements | Targets | |
| Participation rate in human rights education programs (e-learning) under the Standards of Conduct for Toshiba Group |
99.6% | 100% | 100% | 100% |
| Human rights due diligence initiatives Percentage of companies monitoring the actual status using the Risk Assessment Program (RAP) for Group companies* |
ー | 100% | 100% | 100% |
- Companies covered by RAP (80% of Toshiba Group companies)
See below for details of achievements and initiatives.
Promote sustainable procurement (strengthen supply chains)
| KPIs | FY2023 | FY2024 | FY2025 | |
|---|---|---|---|---|
| Achievements | Targets | Achievements | Targets | |
| Obtaining consent for the Toshiba Group Procurement Policy from new suppliers | 100% | 100% | 99.8% | 100% |
| Number of companies where we conducted our Sustainable Procurement Survey*1 | 13,014 | 13,000 | 12,322 | ― |
| Implementation rate of Evaluation of Environmental Management | - | - | - | 100% |
| Implementation rate of sustainable procurement training for procurement employees*2 | 100% | 100% | 100% | 100% |
- Sustainability Procurement Survey: a survey to evaluate suppliers’ CSR initiatives. The number of companies is the cumulative total. Conducted 100% at key suppliers
- Process Transformation Division, Procurement personnel
See below for details of achievements and initiatives.
Strengthen R&D to Stimulate Innovation
See below for details of achievements and initiatives.
For further strengthening thorough governance
Strengthen governance and compliance
| KPIs | FY2023 | FY2024 | FY2025 | |
|---|---|---|---|---|
| Achievement | Target | Achievement | Target | |
| Compliance score in the employee engagement survey | ― | 68 points | 68 points | 69 points |
| KPIs | FY2023 | FY2024 | FY2025 | |
|---|---|---|---|---|
| Achievement | Target | Achievement | Target | |
| Compliance score in the employee engagement survey | ― | 68 points | 68 points | 69 points |
Strengthen cyber resilience and the safe and secure use of AI
| KPIs | FY2023 | FY2024 | FY2025 | |
|---|---|---|---|---|
| Achievements | Targets | Achievements | Targets | |
| Self-assessment of cyber security management maturity*1 | 3.58 | Higher than previous fiscal year (upon reaching 4, remain at 4 or higher) | 3.62 | Higher than previous fiscal year (upon reaching 4, remain at 4 or higher) |
| Number of AI experts*2 | 2,300 | ー | ー | ー |
| Percentage of employees using AI*3 | ー | 30% | 32% | 40% |
- 1 At key Group companies, Toshiba Elevator and Building Systems Corporation, Toshiba Lighting & Technology Corporation, Toshiba Plant Systems & Services Corporation, Toshiba Development & Engineering Corporation (renamed Toshiba Unified Technologies Corporation on April 1, 2025), and NuFlare Technology, Inc.
- At Toshiba, Toshiba Energy Systems & Solutions Corporation, Toshiba Infrastructure Systems & Solutions Corporation, Toshiba Electronic Devices & Storage Corporation, Toshiba Digital Solutions Corporation, Toshiba Tec Corporation, Toshiba Elevator and Building Systems Corporation, and Toshiba Lighting & Technology Corporation
- Applies to employees across all Toshiba Group companies in Japan who use a PC in their daily work.
See below for details of achievements and initiatives.
- Toshiba Infrastructure Systems & Solutions Corporation has been integrated into Toshiba Corporation on April 1, 2025.
- Toshiba Energy Systems & Solutions Corporation and Toshiba Digital Solutions Corporation were integrated into Toshiba Corporation as of April 1, 2026.
Review of Material Issues
Under the Toshiba Group Vision, and in light of changes in the social environment and requests from stakeholders, Toshiba Group has reviewed the material issues that were established in FY2021. We have updated them to incorporate the perspective of value creation for society and customers. Discussions are currently underway for their implementation starting in FY2026.
To achieve mid- to long-term growth and enhance corporate value through 2030 and 2050, we have classified these issues into two categories: “material issues for value creation,” which comprise value creation for society and customers, as well as the sources of value, and “material issues for management foundation,” which comprise building a foundation for growth and fulfilling our responsibilities as a corporate citizen.
As with our previous material issues, we will continue to hold discussions on these initiatives and their progress at the Sustainability Promotion Committee, the Toshiba Group Environmental Management Committee, and the Sustainability Strategy Committee. In addition, to strengthen the promotion structure for the “material issues for value creation,” we will establish a new framework with executive officers in charge, while also moving forward with the establishment of specific measures and KPIs.

Toshiba Group’s material issues
Process of Material Issues Identification
When we first identified our material issues in 2021, we referenced sources such as the 169 targets of the SDGs, the World Economic Forum’s Global Risks Report, the SASB Standards, and the criteria of ESG rating agencies to extract key issues. We then evaluated these based on their relevance to Toshiba Group’s key business areas and the status of our current initiatives to formulate our material issues.
For this review, we took into account the latest Global Risks Report, changes in the business environment, and our new medium-term business plan (the “Revitalization Plan”). Based on the principle of “double materiality” and incorporating feedback from external experts, we prioritized the issues from the dual perspectives of our company’s impact on society and the environment, and society and the environment’s impact on our business. These priorities were then deliberated on by the Sustainability Strategy Committee and reported to the Board of Directors.