Density (Consistency) Meter Principle and Feature
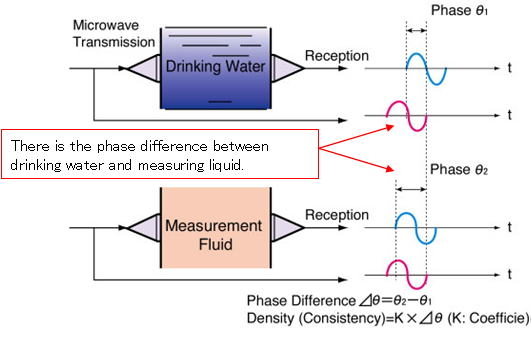
Density (Consistency) Meter Measurement Principle
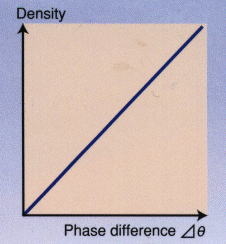
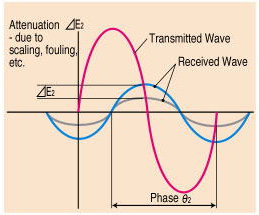
The figure below illustrates the clear linear relationship between fluid density (consistency) and phase θ1 and phase θ2 (i.e., phase difference) of a wave transmitted through drinking water (0% density or consistency) and that passed through another fluid of different density (consistency) and comparing them against the wave's original phase.
Density (Consistency) Meter Feature
Accurate measurements are achieved since contaminents do not easily affect the phase difference measurement
Since contaminent do not easily affect the LQ series Density (Consistency) Meter, there is an excellent direct relationship between the phase difference and the concentration.
Accurate measurement is realized over a wide range from low concentration to high concentration.
Conventional ultrasonic and optical measurement
Microwave phase difference measurement Attenuation ⊿E2: that results from scaling of founding causes measurement errors in the positive direction.
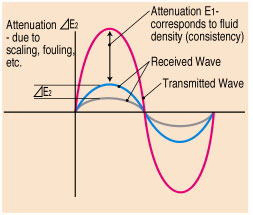
Microwave phase difference measurement
Because scaling, founding do not easily affected phase, measurements are guaranteed to be accurate and reliable.
High reliability, easy maintenance
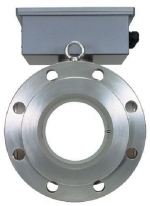
No moving parts and no in-line projections guarantee high reliability and minimal maintainance requirement.
The absence of moving parts also greatly reduces costs for consumable like O-rings and bearings.
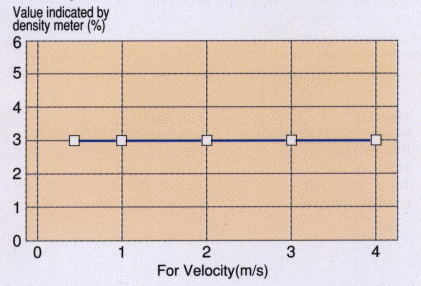
Impervious to flow velocity
No moving parts means measurement of any fluid flowing through the system.
Continuous in-line measurement
Installation into piping allows continuous density (consistency) measurement of any fluid flowing through the system.
Easy operation
Setting the measurement range and calibrating the meter are easily done via key operations while viewing the LCD display.
Configuration diagram for communication
The LQ series has the HART protocol(*) as standard. We can check the density from far place connecting 4 to 20mADC current output line in Hand-held terminal.
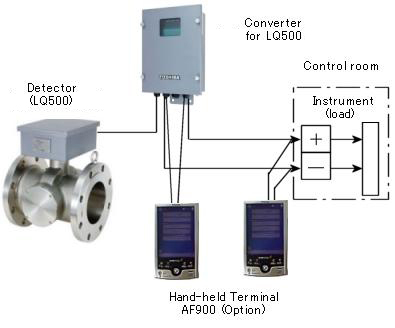
- * HART protocol (Highway Addressable Remote Transducer) is a communication protocol for industrial sensors recommended by the HCF (HART Communication Foundation).