Product Overview
As a manufacturing company, the Toshiba Group brings together production technologies and know-how cultivated over many years. We link various system data in manufacturing and collected IoT data for accumulation, thereby providing a solution for effective data utilization.
Product Lineup
Enhances the utilization of manufacturing data and supports transformation from on-site to management
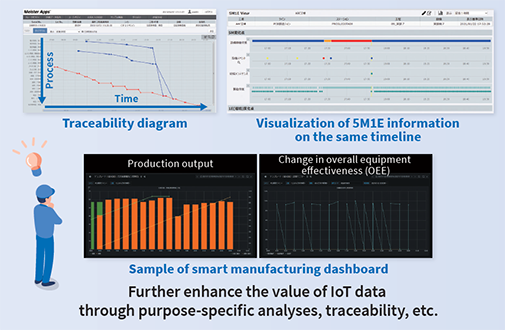
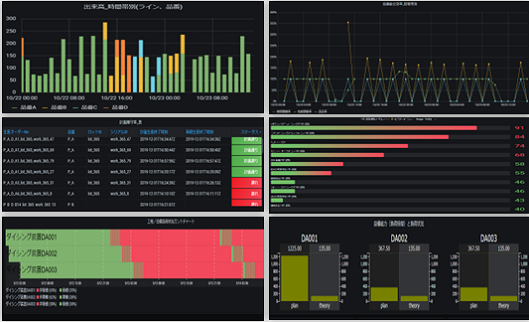
The extensive dashboard templates respond to needs and use cases from the on-site to management; for example, reducing defect rates, improving operating rates, achieving traceability, and optimizing inventory. This enables visualization and analysis from various perspectives, including assessment of on-site changes and investigation of the causes of problems.
- Contributes to on-site improvement by using factor analysis and traceability functions to identify the causes of problems
- Provides dashboard templates that allow a quick understanding of on-site conditions
- Depending on customer use, visualization components can be used to create original dashboards
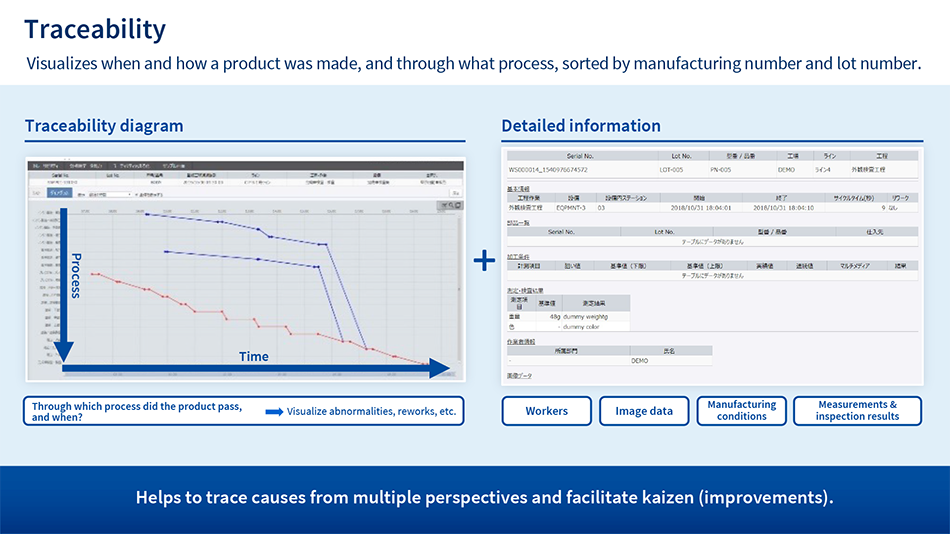
Traceability
When a post-shipment or in-process defect occurs, this function traces when, where, and how the target product was manufactured, and how far the impact of the defect has spread.
Based on information including IoT data from the manufacturing process, the function estimates patterns of defect causes to realize traceability in the IoT era.


*Man, Machine, Material, Method, Measurement, Environment
We also provide dashboard templates and visualization components that allow users to create original dashboards by freely arranging and resizing elements.
Dashboard templates
In addition to monthly and daily reports, we provide about 10 types of dashboards for uses such as improving quality and understanding production status at related factories.
Visualization templates
We provide about 50 types of graph components as visualization components. Each components combines graphs or tables with data items and formulas to cover data such as production plans versus actual results, overall equipment efficiency, inventory and dwell time, and shipment status.
*As of July 2024
Integrated data model for supporting various types of manufacturing
The Manufacturing Data Integration Platform eliminates the complex preparation work of linking operational and IoT data with different granularities for data integration, management, and utilization. This enables data linkage across factories and realizes smart factories.
- Integrates and manages a wide variety of data related to manufacturing
- Provides a manufacturing-oriented integrated data model that easily links data in a form that facilitates easy data utilization and analysis
- Integrates data distributed across factories, thereby contributing to strengthening management across the entire manufacturing process
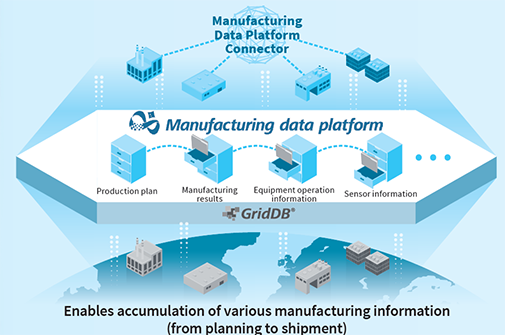
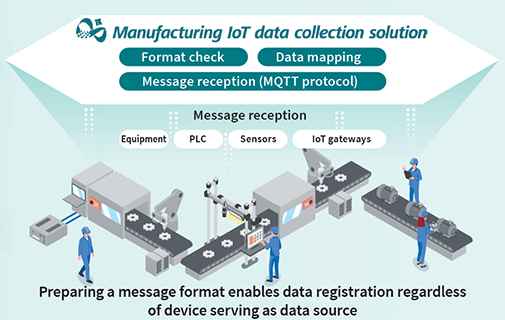
Linking IoT data collected from equipment and personnel to the Manufacturing Data Integration Platform
Provides an interface that easily links IoT data such as sensors and logs generated in real time to the Manufacturing Data Integration Platform. This allows data registration via messages regardless of the source system or equipment.
- Links manufacturing work records and quality inspection results, including start/end times and processing conditions for each manufacturing process
- Links equipment operational status, alerts, maintenance events, and manufacturing information from the equipment perspective
- Links measurement values from sensors installed on equipment or personnel