
Toshiba's Polyspector™ Creates Powerful Visualization Platform for Big Data
Toshiba has demonstrated its leadership in developing tools and solutions that support big data mining and analysis with the development of Polyspector™, a big data visualization platform that realizes interactive visualization of hundreds of millions of pieces of data from various perspectives. Toshiba delivered a detailed demonstration of Polyspector™ on October 17, 2016, at the 29th ACM User Interface Software and Technology Symposium in Tokyo, Japan.
In supporting the development of today's advanced information society, Toshiba has created innovative services and products that bring novel added-value and dramatic improvements in efficiency to big data applications, including data collection, analysis and processing. The development of Polyspector™ now makes it possible to visualize data from various perspectives and offers a new and effective way to quickly see and intuitively grasp trends and problems in collected data.
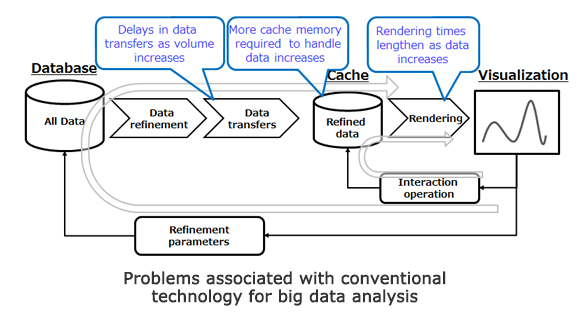
Conventional visualization technologies, such as business intelligence tools(Note 1), display graphics by preparing and rendering data for visualization. However, as the volumes of data to be visualized continue to grow at an explosive rate, processing for displaying graphics entails enormous computational costs and long computation times that prevent the screen from updating during processing. However, if the amount of data is reduced during preparation by, for example, performing statistical analysis, trends and problems in the collected data may be overlooked. It is necessary to develop big data interactive visualization technology that can handle the explosive increases in data volume expected in the future,
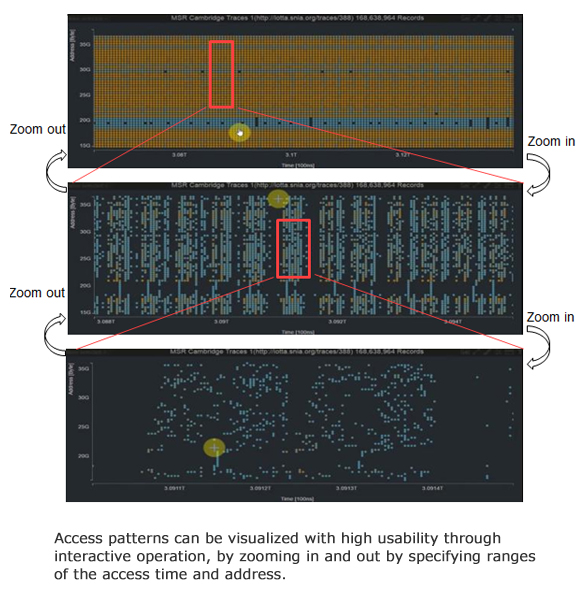
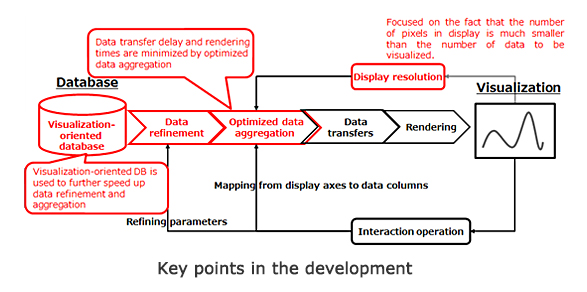
In meeting these requirements, Toshiba has developed technologies and a platform that dramatically reduce time needed for preparing and rendering data while maintaining the appearance of visualization results—whether an overview of an entire dataset or a detailed view of a selected area (video image). Because the number of pixels in a screen is smaller than the number of data in big data visualization, a view of hundreds of millions of data points can be created in about 1 second by ordinary personal computers when Toshiba's novel database engine is used to optimally refine and aggregate multiple pieces of data mapped at the same screen location as a data object(Note 2). For example, time-series data logs, whether for months or microseconds, can be displayed freely and promptly in an overview or in a detailed view of a selected area by zooming out or in.
The present platform is accessed via a web browser to a remote processing server that can be installed locally or in the cloud.
Visualization of storage trace data collected every 100 ns for 7 days
*160 million records
*X-axis: Time when the storage was accessed
Y-axis: Address where the storage was accessed
* Click Play button to start movie. YouTube is the service provided from other company, and please follow the terms of use in YouTube.
Toshiba plans to commercialize services that utilize the Polyspector™ platform by 2018.
- (Note 1)
- Methods used for corporate decision making based on accumulation, analysis, and processing of big data within an enterprise.
- (Note 2)
- A group of data or processes having the same theme.