
Development of a technology for high-performance measurement of group sizes
Overview
We have developed a new technology for precisely calculating the number of persons and vehicles in a wide-angle video shot from a single camera. (Ref. 1)
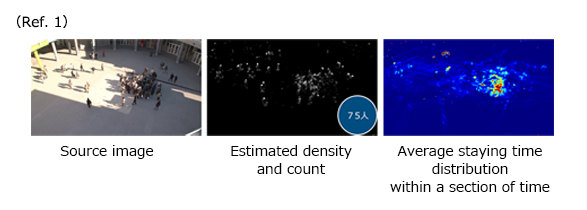
This technology is applicable to even videos where target objects overlap or are extremely small, and publicly released evaluation image data(Note 1) shows the highest performance yet achieved in terms of calculation error. We will present the results of this technology on 15 December at ICCV 2015 (Santiago, Chile), the world's largest computer vision conference.
Development Background
There are currently around 28 million security cameras installed worldwide, and because of their utility in helping to solve crimes, the need for further installations continues to grow. Image processing technologies such as face recognition and human detection are also being implemented with the goal of creating a safer and more secure society and providing more advanced security solution services. Human and vehicle traffic density and congestion are factors that frequently contribute to problems, so in regard to smoothing and improving the efficiency of administrative work through labor savings and improved visualization, there is utility in more accurately calculating the congestion level of persons in a group. Current technologies for group measurement estimate group's sizes by using a measurement index called a density map(Note 2). However, density maps estimate the existence probabilities of persons or objects based on the brightness levels of all pixels in the target image, meaning that numerous calculations are required, and performance improvements generally require the use of large amounts of memory.
Features of the Technology
In contrast to conventional methods for directly estimating a group density map from images, we have developed a unique machine learning method called Co-voting an Uncertain Number of Targets (COUNT). Whereas conventional technologies learn existence probabilities to represent whether a human is present in each pixel, our method avoids such per-pixel decomposition and instead statistically learns the number and position of persons in an image, thereby estimating their offset position vectors. These estimated positions are used to calculate a group density map by superimposing previously created single-person density maps following a normal distribution(Note 3). This enables learning based on group sizes and locations, and as a result, the number of persons and objects can be estimated with less memory use and higher precision compared with conventional methods (Ref. 2).
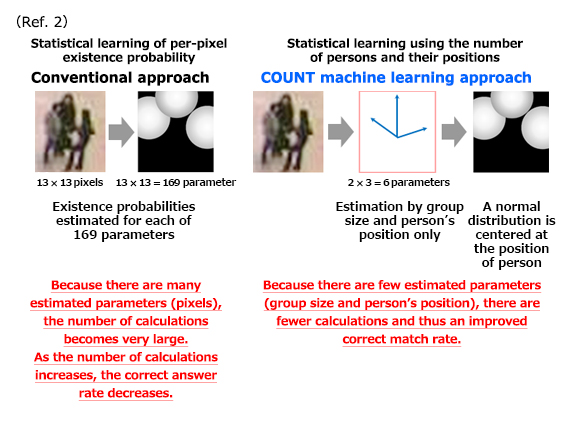
Previously published best-performance data(Note 4) had an average absolute error(Note 5) of 3.43 persons, but our method has improved upon this, with an average absolute error of 2.50 persons. For another set of published data, the average absolute error was 2.10 persons by a conventional method but 1.59 persons by our method, which used only one-thirtieth of the memory.
Future Developments
By 2016, we hope to incorporate this technology into our RECAIUS cloud service, which allows IT activities while seeing, hearing, and speaking with others. This technology allows balancing and energy reduction through discovery and notification of locations where many people are congregating. Moreover, visualization of such locations allows for consideration of congestion mitigation measures. The method can be further expanded to allow for simultaneous calculation of the number of pedestrians and vehicles at locations such as congested intersections.
- (Note 1)
- An evaluation image data is an image data of the respective universities exposes the purpose of evaluation methods. We use Mall data and UCSD data commonly used in the evaluation of person counting.
- (Note 2)
- A density map is an image in which brightness levels are associated with existence probabilities in processed images: the higher the brightness value, the higher the density.
- (Note 3)
- A normal distribution is one of the most commonly used probability distributions, with "occurrence probability" being highest in the area near the average value.
- (Note 4)
- The public data set is a video with 2000 frames, with an average of 31 persons (range: 13-53 persons) per frame. Average absolute error is estimated based on learning from 800 images and evaluation of 1200 images.
- (Note 5)
- The average absolute error is the average of the absolute value of the difference between the correct and estimated number of people present in each evaluated frame.