Manufacturing sites are being tasked not only with productivity improvements, but also with addressing issues involving personnel, such as how to pass on the skills of experts to junior personnel and how to improve operation efficiency. That is making it more important than ever for them to eliminate inefficient operations, optimize workloads, share information in a timely fashion, provide speedy remote support, and prevent accidents and injuries to create comfortable and safe working environments.
To address these workplace issues, Toshiba Digital Solutions supplies Field Work Visualization Package, a solution that uses IoT and AI technology to identify and analyze worksite conditions from a 5W1H perspective. Let's get an overall view of this solution and look at the benefits it provides and potential use cases.
Personnel-focused manufacturing worksites and the challenges faced when deploying the IoT
Many manufacturing companies are finding themselves facing personnel-related challenges. According to the 2020 Manufacturing White Paper issued in May 2020 by the Ministry of Economy, Trade and Industry; the Ministry of Health, Labour and Welfare; and the Ministry of Education, Culture, Sports, Science and Technology, over 40% of manufacturing companies have indicated that they face personnel-related issues such as labor shortages and personnel development challenges. This was the highest percentage of the many business issues covered by the study. The percentage of companies that answered that they faced personnel-related issues was roughly the same for both large companies and SMEs, which shows that this is a problem that affects the manufacturing industry as a whole, regardless of company scale.
Furthermore, this white paper also investigated the five-year outlook for work performed by human personnel that is currently essential for manufacturing worksites. It indicates that although many companies will utilize robots and AI, and automation will progress, people will continue to handle important works that require polished skills.
Based on this, it is clear that actual manufacturing worksites need to deal with the issues of labor shortages and the development of personnel while improving the efficiency of their production activities. There are high hopes that worksites will implement various measures to improve operational efficiency and productivity while making workplaces more comfortable for workers. This includes making ongoing operational efficiency improvements aimed at boosting productivity, rapidly responding to sudden problems and instituting permanent countermeasures, optimizing personnel assignments based on day-to-day plans, optimizing workloads to eliminate operation errors, providing rapid remote support for workers, assessing work environments, identifying the health status of personnel in order to prevent bad health conditions, accidents, and injuries, and more.
These expectations place an even greater burden on worksites. One way to address these issues is to use the IoT.
However, the deployment of IoT technologies in the field has been little progress. Some of the main reasons given for this are that deploying IoT technologies requires significant capital investment, that it places additional burdens on workers in the field (such as by increasing their workloads or giving them the sense that they are constantly being watched), that it is hard to conceptualize how the data acquired from devices could be used, and that it takes a long time for the benefits to become apparent.
To respond to these concerns of manufacturing companies and workers in the manufacturing sector, Toshiba Digital Solutions has leveraged the manufacturing field expertise it has built up through the years to develop a little-burden, easy-to-deploy IoT solution.
The keys to improving productivity are worksite operation visualization and AI inference based on 5W1H
What can companies achieve by using the IoT? We believe that it is important to begin by using data acquired via the IoT to determine the five Ws and the H: who, what, where, when, why, and how, and to use that information to visualize conditions in the field. By using 5W1H to identify worksite conditions, companies can make ongoing improvements to field work -- that is, they can accomplish their core objective of improving their worksite capabilities.
After much consideration, we selected beacons, wristband sensors (MULiSiTEN), and smartphones as the measurement devices for acquiring this 5W1H information.
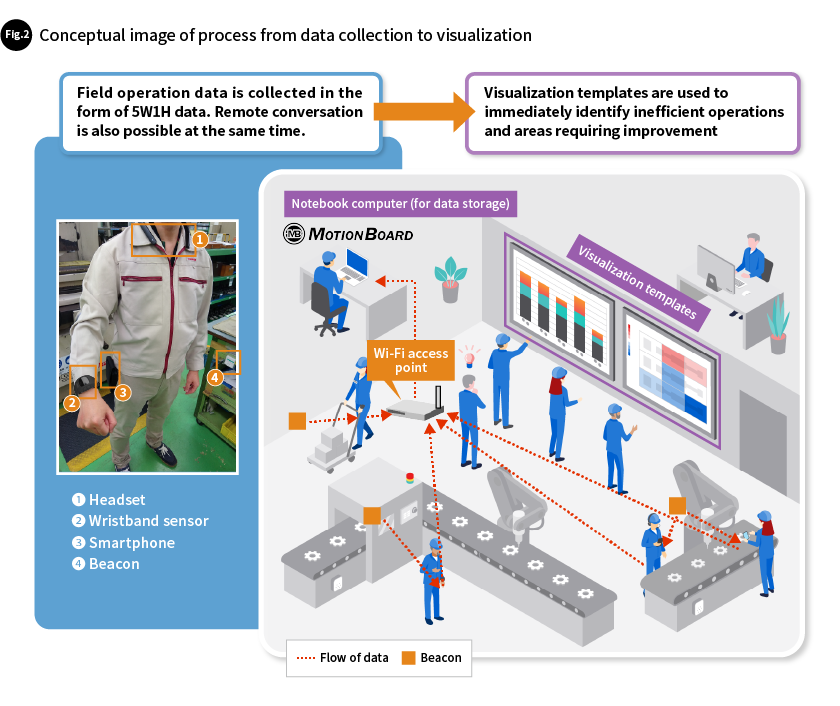
Beacons are compact and easy to install. It is easy to place them throughout areas where you want to know workers' locations, to relocate them to other areas, and to place them on work devices when you want to identify movement routes. Furthermore, the strengths (ranges) of the signals emitted by individual beacons can be changed as needed based on customer usage applications and conditions. The ability to use them only when needed also reduces the workload placed on people in the field. The wristband sensors are worn on operators' wrists and acquire acceleration data along the X, Y, and Z axes. Our AI technology is then used to infer what actions are being taken by operators. As these devices are evolving, we are also working on measures focused on operator health, such as acquiring temperature and humidity data and data regarding operator stress levels and heart rates produced by heat, and then using this data to visualize operators' health conditions. Smartphones can be used to share information such as recordings of calls made by operators, conversations between field personnel, and other related information, as well as to transmit data acquired using beacons and wristband sensors to the data storage platform in real-time. By using all of this data, which is acquired automatically, the system determines field work conditions from the perspectives of 5W1H (Fig. 1).
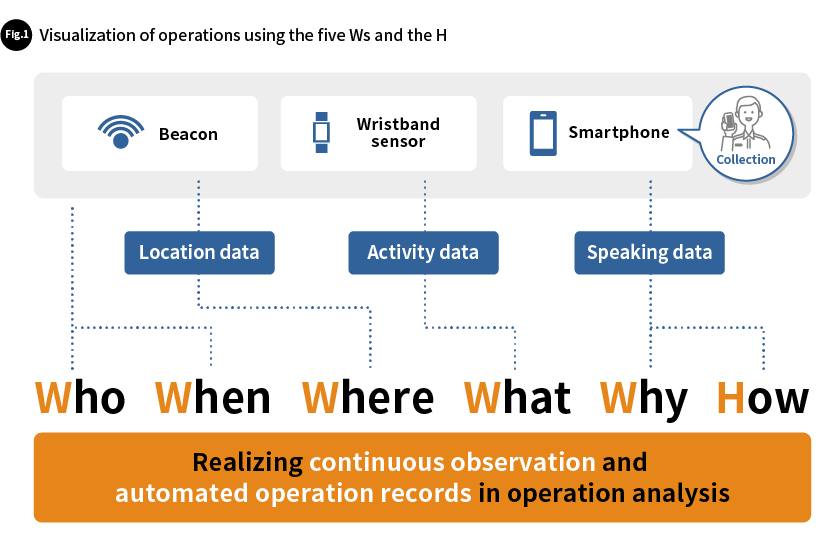
Operator data obtained using beacons, wristband sensors, and smartphones is stored in a notebook computer used as a data storage platform. Operator location data, activity data, speech data, and other information is stored chronologically in the data storage platform, enabling uninterrupted activity observation.
A variety of templates are provided for visualizing this collected data from different perspectives. This includes the ability to create graphs and heat maps of work contents, time spent in each location, movement routes, and the like. Gaps between standard and actual work times can be visualized, along with the workloads of individual operators, to identify inefficient operations and issues with personnel allocation. This makes it possible to deliberate and implement measures for improving work efficiency and optimizing workloads, which contributes to overall productivity improvement. Visualization can be used to rapidly identify problems and areas where improvements are required (Fig. 2).
What is important in this visualization is to be able to make inferences regarding operation activity. Based on the three-axis accelerometer data acquired using wristband sensors, we use AI to categorize activity into four categories: "manual work," "dolly movement," "walking," and "standing still." This is accomplished using "SATLYS KATA Work Activity Estimation service," our AI analysis service that specializes in inferring operator behavior. SATLYS KATA is the culmination of our AI analysis knowledge and expertise, designed to be able to be applied immediately to specific operations.
* "SATLYS KATA Work Activity Estimation service" is presented in detail in DiGiTAL T-SOUL Vol.31.
We provide the Field Work Visualization Package as a solution for improving work efficiency and productivity by identifying the 5W1H of actual worksite operations.
Field Work Visualization Packages include beacons, wristband sensors, smartphones, notebook computers that serve as data storage platforms, devices for creating the Wi-Fi access points essential for transferring data from smartphones to notebook computers, and manuals packed with information about how to deploy and operate the solution, apply visualization templates, and effectively use data. This is an all-in-one package with minimal initial deployment costs by carefully selecting the devices needed from data collection to visualization. These are provided through a subscription model, which assists with adjusting scales and usage periods based on operation improvements and current operating conditions, and reducing the effort involved in equipment procurement and asset management. There is also a trial service available for short-term use.
Specific application scenarios for collected data and deployment case examples
The Field Work Visualization Package can be applied to a wide range of use cases. It can be used in many ways, such as automating the creation of operation records using 5W1H information, identifying and eliminating inefficient operations, and helping combat the spread of COVID-19 by identifying crowded conditions (Fig. 3).
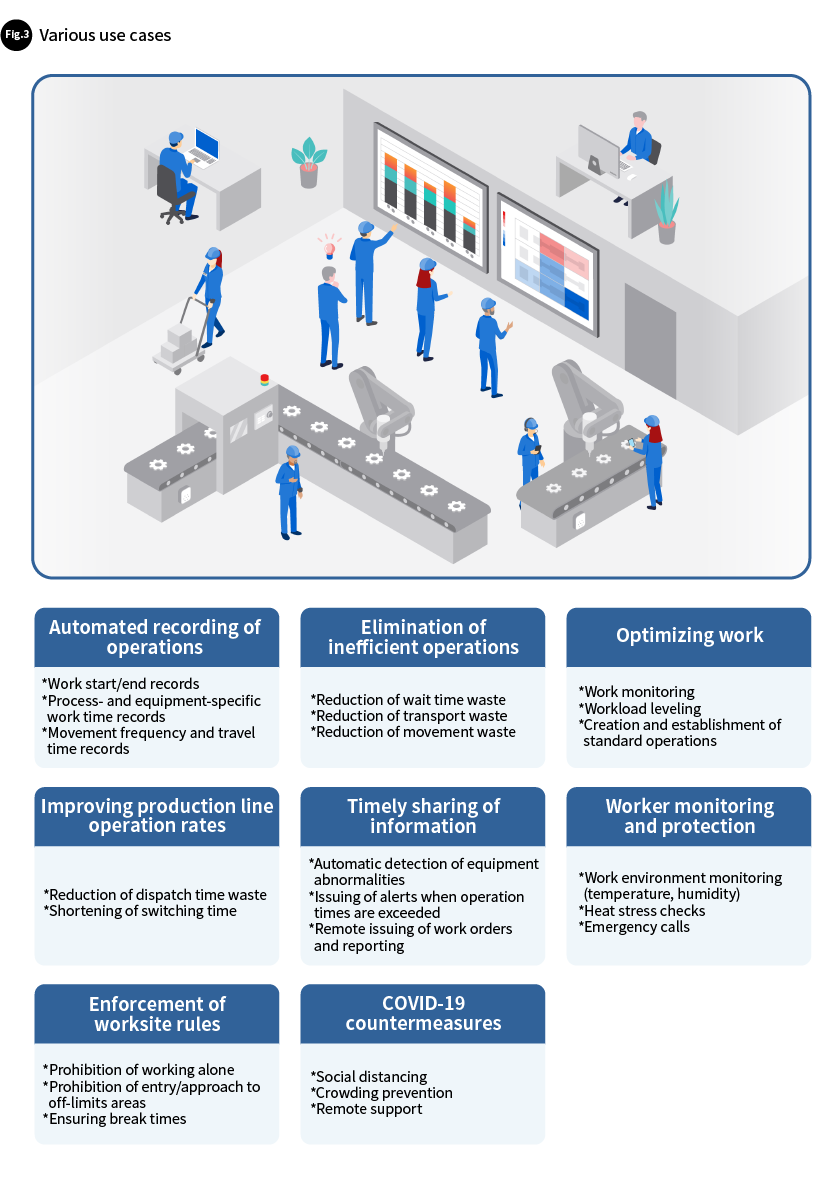
For example, when applied to the transport of articles within factories, analyzing location and movement data makes it possible to optimize movement routes. Sometimes routes that appear on a map to be the shortest routes actually include areas that are difficult to traverse, so operators end up using unexpected routes instead. In some cases, workers use these alternative routes unconsciously, to avoid objects placed on designated movement routes, so they may not mention them in their reports. By identifying this phenomenon when it occurs, along with the cause of the phenomenon, and taking appropriate steps in response, worksites can not only optimize their movement routes but also achieve greater work efficiency and safety.
The Field Work Visualization Package also contributes to the monitoring and protection of workers. In some worksites, personnel may need to work at night, or on their own. If a wristband sensor detects that a worker is suffering from some sort of health issue, it notifies their supervisor and a response can be taken. Linking work environment and worker monitoring and communication functions provides workers with workplace environments in which they can enjoy peace of mind.
Furthermore, the solution can be used to provide alerts and analyze equipment abnormalities. Data is integrated with the systems used to manage equipment. This assists with sharing information in a timely fashion when an abnormality occurs and taking corrective action. The actions of personnel and equipment can also be compared using the same timeline when performing a follow-up analysis. This enables the visualization of the state of equipment and how it changed over time following the occurrence of the abnormality, along with the actions taken by personnel at the same time. This visualization contributes to the deliberation of improvement measures such as measures for optimizing personnel assignment and revising skill requirements.
The solution can also be used in the visualization of the movement of transport vehicles used in the field, such as forklifts, automatic guided vehicles (AGVs), and cranes. Movement bottleneck locations and routes can be quantitatively identified and the causes of these bottlenecks can be eliminated, which helps improve productivity significantly.
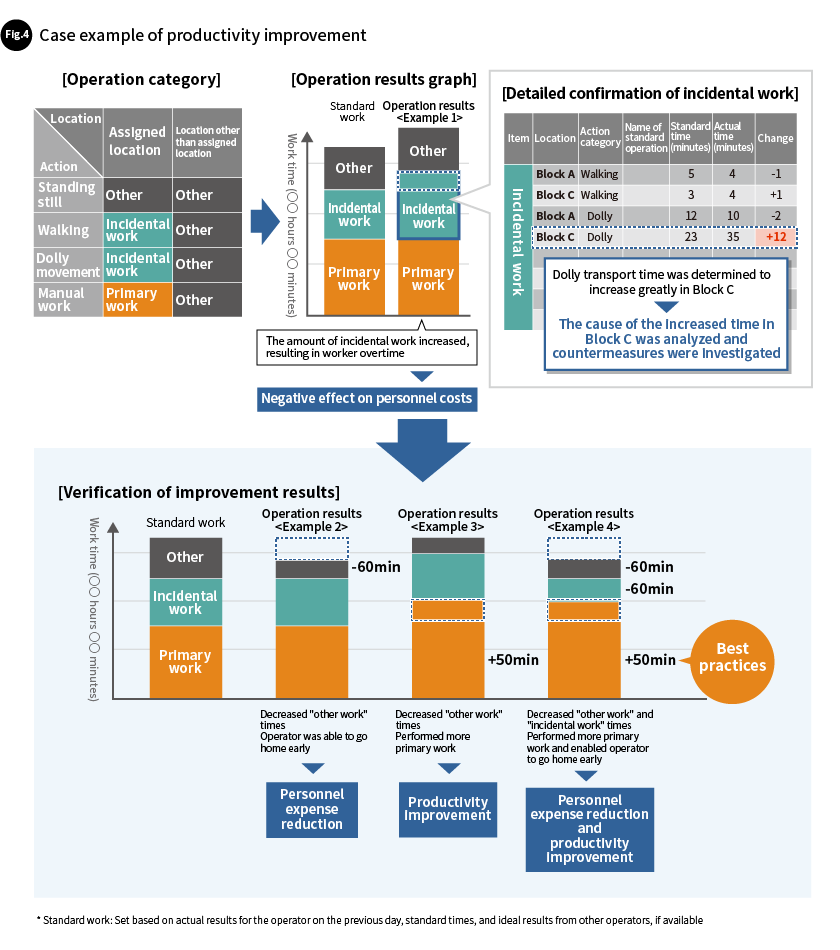
There are case examples of the solution being used to make actual productivity improvements. Information about operations, categorized as manual work, dolly movement, walking, and staying still, and location information used to determine if an operator is in their assigned work space, has been used to categorize work content as "primary work," "incidental work," and "other." Actual work times and standard work times for each operation have been graphed and compared. The data has been used to determine when the amount of incidental work had increased, and detailed data investigation found areas requiring improvement, such as major increases in dolly movement time in specific areas. The causes of these issues were analyzed, and countermeasures were put into effect. Pre- and post-improvement data were compared, and the outcomes of the improvements were analyzed. This analysis found that the improvements had increased the amount of time that could be spent on primary work and reduced the overall time required to perform work (Fig. 4).
The Field Work Visualization Package is being used in a wide range of business categories and operations such as logistics warehouses, food processors, and retail stores, and has been praised for how quickly it identifies operation waste.
The Field Work Visualization Package assists in improving worksite operation efficiency and productivity and creating more comfortable work environments by continually visualizing and analyzing operations. Toshiba Digital Solutions will continue to supply this solution that helps solve the problems encountered in manufacturing sites.
- The corporate names, organization names, job titles and other names and titles appearing in this article are those as of Februry 2023.
- Other company names and product names mentioned in this article may be trademarks or registered trademarks of their respective companies.
- Field Work Visualization Package and other products mentioned in this article are not currently available for purchase outside Japan.